Storage


G-Technology G-Drive with Thunderbolt 8TB Capsule Review

G-Technology G-Drive with Thunderbolt 8TB Capsule Review

G-Technology started using HGST’s helium-filled hard drives in their direct-attached storage (DAS) products earlier this year. The product lines utilizing these 8TB and 10TB drives include:

  • G-Drive with Thunderbolt (single drive enclosure)
  • G-Speed Studio with Thunderbolt (four-bay enclosure with hardware RAID)
  • G-Speed Studio XL with Thunderbolt (eight-bay enclosure with hardware RAID)
  • G-Drive USB (single drive enclosure)
  • G-RAID USB (two-bay hot-swap enclosure with hardware RAID)
  • G-RAID with Thunderbolt (two-bay hot-swap enclosure with hardware RAID)
  • G-Speed Shuttle XL with Thunderbolt (eight-bay / six-bay + 2 ev Series adapters hot-swap enclosures with hardware RAID)
  • G-Speed Studio XL with Thunderbolt(six-bay + 2 ev Series adapters hot-swap enclosures with hardware RAID)
  • G-Rack 12 and G-Rack 12 Exp expansion chassis (NAS with 12 bays + 12 additional expansion bays using G-Technology’s custom NAS OS based on btrfs)

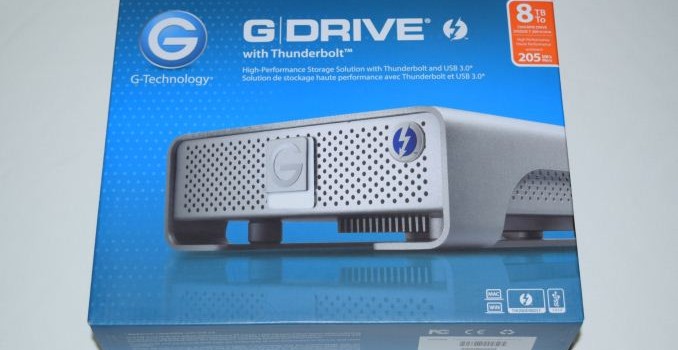
We have not published any hands-on reviews of G-Technology’s products till now. Keeping that in mind, G-Technology wanted to start us off with one of their basic offerings – the G-Drive with Thunderbolt. The 8TB version packs a HGST Ultrastar He8 3.5″ SATA hard-drive in a sealed enclosure with one Thunderbolt port and one USB 3.0 port. At any given point of time, either device port can be used to access the drive. The G-Technology G-Drive with Thunderbolt 8TB currently sells for $600. The HGST Ultrastar He8 sells for approximately $500 (the official version with warranty from HGST), putting the cost of an all-aluminum, Thunderbolt + USB 3.0 enclosure at $100. As far as the premium for Thunderbolt peripherals go, the pricing is not outrageous. That said, we must keep in mind that the device uses the first-generation Thunderbolt silicon / mini-DP-type port.

Product Impressions and Platform Analysis

The G-Drive with Thunderbolt package comes with a 24W (12V @ 2A) adapter in addition to a Thunderbolt and a USB 3.0 cable. A quick-start guide is also included.

The industrial design of the product is excellent, and the aluminum chassis with the curved edges provides a stylish and premium look. A Thunderbolt logo in the front panel differentiates it from the other single-bay USB products in the G-Technology lineup. A white LED beneath the G-Technology logo indicates the power / hard drive access status.

The gallery above shows the layout of the rear panel – a Kensington lock, a USB 3.0 Type-B female port, a Thunderbolt port, the power inlet and an explicit on/off switch. The underside also sports a ridged segment to aid in taking away heat from the component in contact with it on the inside.

Getting access to the internals of the unit is a matter of removing a few screws from the frame that serves to keep the main part of the chassis raised. Unfortunately, doing so voids the warranty.

A close-up view of the board reveals the various chips making the product work. From the bottom left, we can see the following as we trace an arc to the right.

  1. ASMedia ASM1053 USB 3.0 to SATAII bridge chip with UASP support. It has been superseded by the ASM1153 bridge chip now, and the ASMedia website no longer carries information about the ASM1053.
  2. ASMedia ASM1456B SATA signal switcher: It demultiplexes the hard drive’s SATA pins to either the ASM1053 USB bridge or the SATA host controller connected to the Thunderbolt controller.
  3. ASMedia ASM1061 SATA host controller with a PCIe 2.0 x1 uplink and 2x SATA III downstream ports.
  4. Intel DSL2210 single-channel Thunderbolt controller with two PCIe lanes
  5. NXP LPC1114F 32-bit ARM Cortex-M0-based MCU

Apple users are the main target market for G-Technology. Therefore, the internal hard drive comes pre-formatted in HFS. We connected the unit to our Skylake DAS testbed using a StarTech.com Thunderbolt 3 to Thunderbolt adapter. The same Type-C port in our testbed was also used to connect the unit over USB 3.0 (using the appropriate Type-C to Type-A cable adapter). After re-formatting the disk in NTFS, our first task was to take a look at the CrystalDiskInfo reports from both interfaces.

We get confirmation of UASP support over the USB interface. Over Thunderbolt, the device appears as a regular SATA drive. S.M.A.R.T read-out is supported over both interfaces for drive monitoring.

Performance Evaluation

Our testing methodology for DAS units takes into consideration the usual use-case for such devices. The most common usage scenario is transfer of large amounts of photos and videos to and from the unit. The minor usage scenario is importing files directly off the DAS into a multimedia editing program such as Adobe Photoshop. Prior to taking a look at the real-life benchmarks, we first check what CrystalDiskMark reports for the G-Drive with Thunderbolt 8TB over both the available interfaces.

For the most part, the performance numbers meet G-Technology’s claims. Sequential workloads can easily sustain 200 MBps over the fastest platter tracks. However, the USB 3.0 bridge chip seems to have some trouble with high queue-depth sequential accesses, as the results for those particular traces don’t match up with what we observe over the Thunderbolt connection. This is because the ASMedia ASM1053 has a SATA II interface. SATA II doesn’t support some of the advanced NCQ (native command queueing) features that are part of the SATA III specifications. However, for the 1MB sequential accesses at low queue depths, the USB 3.0 and Thunderbolt interfaces perform very similar to each other.

In order to tackle the first real-life use-case, we created three test folders with the following characteristics:

  • Photos: 15.6 GB collection of 4320 photos (RAW as well as JPEGs) in 61 sub-folders
  • Videos: 16.1 GB collection of 244 videos (MP4 as well as MOVs) in 6 sub-folders
  • BR: 10.7 GB Blu-ray folder structure of the IDT Benchmark Blu-ray (the same that we use in our robocopy tests for NAS systems)

Each of the above folders was transferred from a RAM drive to the DAS unit and back to the RAM drive thrice. The average of the three transfer rates is recorded in the table below for each type of content.

G-Technology G-Drive with Thunderbolt 8TB robocopy Benchmarks (MBps)
  Thunderbolt USB 3.0
Write Bandwidth Read Bandwidth Write Bandwidth Read Bandwidth
Photos 150.59 159.45 127.94 186.13
Videos 164.07 171.72 193.03 186.83
Blu-ray Folder 181.61 182.20 186.48 191.46

The above benchmark run was also instrumented to record the drive temperature as well as instantaneous transfer rates during the process. The internal disk temperature never crossed 50 C even after more than 127 GB of writes and 127 GB of reads continuously.

For the second use-case, we take advantage of PC Mark 8’s storage bench. The storage workload involves games as well as multimedia editing applications. The command line version allows us to cherry-pick storage traces to run on a target drive. We chose the following traces.

  • Adobe Photoshop (Light)
  • Adobe Photoshop (Heavy)
  • Adobe After Effects
  • Adobe Illustrator

Usually, PC Mark 8 reports time to complete the trace, but the detailed log report has the read and write bandwidth figures which we present in our performance graphs. Note that the bandwidth number reported in the results don’t involve idle time compression. Results might appear low, but that is part of the workload characteristic.

G-Technology G-Drive with Thunderbolt 8TB PCMark8 Storage Benchmarks (MBps)
  Thunderbolt USB 3.0
Write Bandwidth Read Bandwidth Write Bandwidth Read Bandwidth
Adobe Photoshop (Light) 196.35 6.06 215.08 6.01
Adobe Photoshop (Heavy) 211.03 8.21 225.84 8.11
Adobe After Effects 51.74 5.91 51.92 5.88
Adobe Illustrator 136.85 5.85 158.41 5.90

Even though these use-cases are part of the typical multimedia workflow, we don’t expect this particular device to be used for such purposes. However, the results are just presented here for the sake of completeness

Power Consumption

The G-Drive with Thunderbolt is externally powered, and the power consumption for a device that might be always attached to a host PC is definitely an aspect to investigate. The power consumption numbers for different types of workloads (as tested by CrystalDiskMark) over both interfaces are presented below. These are at-wall numbers measured using the Ubiquiti Networks mFi mPower Pro.

In addition to the active power, idle power (with the drive on as well as with the drive spun down) was also recorded. Over the Thunderbolt interface, the unit idled at 3.96 W with the drive spun down and 9.68 W with no drive accesses. Over the USB 3.0 interface, the unit idled at 3.55 W and 8.32 W for the same scenarios.

Concluding Remarks

The G-Drive with Thunderbolt 8TB version is a high-capacity DAS unit with a praiseworthy industrial design. The chassis construction is stylish while being practical. The rubber feet and raised profile for the hard drive cage aid in improving the thermal characteristics. The unit is also well-built, sturdy and appears to be durable.

Positives aside, we are unable to fathom the utility of this particular member of the G-Drive lineup over something like the G-Drive USB. The Thunderbolt part has no daisy chaining capabilities (there is only one Thunderbolt port). The high-speed capabilities of Thunderbolt are wasted with a single hard drive at the other end. In addition, the USB 3.0 bridge chip (ASMedia ASM1053) is a bit dated and appears to get hampered under heavy request loading in our tests because the hard drive operates in the SATA II mode when that path is active.

We believe it makes better sense for G-Technology to use Thunderbolt for multi-drive enclosures only and keep single-drive ones as USB 3.0-only DAS units. Another aspect that could be improved in the current unit is the ability for end-users to access the internal drive without voiding the warranty.

Coming to the pricing aspect, the G-Drive with Thunderbolt / USB 3.0 8TB version has a MSRP of $600. For the same MSRP, the G-Drive USB comes with a 10TB drive. In most scenarios, the extra 2TB will be worth much more than a Thunderbolt port connected to a product with a hard drive and no daisy-chaining capabilities. Multimedia professionals involved in photo and video capture / editing have different use-cases / usage scenarios for their data. To G-Technology’s credit, they have hard-drive enclosures catering to all of those scenarios. If you are in the market for a high-capacity external DAS from their lineup, it would be prudent to evaluate the various options carefully before making a purchase decision.

Market Trends Q2 2016: SSD Shipments Up 41.2% YoY, PC Sales Up on Q1

Market Trends Q2 2016: SSD Shipments Up 41.2% YoY, PC Sales Up on Q1

Sales of SSDs in the first quarter of 2016 were up 41.2% year-over-year, based on findings from TrendFocus*, a storage market tracking company. Shipments of all types of SSDs, including drives for client and server systems, were up sequentially and year-over-year, which again proves that NAND-based storage devices are taking the place of traditional hard drives both inside client PCs and enterprise machines.

SSD Sales now above 33.7 Million Units

Shipments of SSDs in the second quarter hit 33.705 million units, which is nearly 10 million units higher than in the same period a year ago and up 9.5% from the previous quarter, according to TrendFocus. According to IDC and Gartner, sales of PCs were also relatively strong in Q2 compared to Q1: the industry sold 62.4-64.3m units, which is flat or slightly up (depending on who you take numbers from). Meanwhile, the SSD market for client PCs and servers has been growing rapidly for many quarters, therefore, and all-time high shipment units in Q2 came as no surprise.

SSD Market at Glance in Q2 2016
Data by TrendFocus
All numbers are millions of units, Exabytes or Gigabytes
  Form-Factor
(Units)
Interface
(Units)
Total Average
Capacity
Drives
2.5″/3.5″
Modules
mSATA/M.2
SATA SAS PCIe Units Exabytes
Client 16.637 13.0 ? ? ? 29.637 8.24 278 GB
Enterprise 3.868 0.2 3.2 0.668 0.2 4.068 4.17 1025 GB
 
Total 20.505 13.2 3.2 0.668 0.2 33.705 12.41 368 GB

There are multiple industrial trends that help to accelerate adoption of SSDs by both client PCs as well as servers:

Firstly, price. Entry-level SSDs are getting cheaper thanks to rapid per-GB price declines of TLC and 3D TLC NAND flash memory. This is combined through competition among vendors as well as the adoption of multiple module form-factors. In the second quarter, average contract prices of 128 and 256 GB SSDs dropped to $37.20 and $60.80 per unit, respectively, according to DRAMeXchange. For example, 120/128 GB SSDs for $35$38 are easy to find at Amazon. Moreover, there are plenty of drives with 240 GB or 256 GB capacities that cost less than $60 at Amazon.

Secondly, rapid performance improvements brought by NVMe protocol and new controllers supporting PCIe 3.0 bus stimulate strong demand for newer SSDs by enthusiasts and boutique PC makers.

Thirdly, new technologies (3D NAND, stacking, etc.) enable companies like Samsung and Toshiba to build SSDs that challenge HDDs not only in terms of performance but also in terms of capacities, thus stimulating demand from datacenters.

Average SSD Capacity Hits 368 GB

The total capacity of all SSDs sold in the second quarter achieved 12.47 Exabytes, up 93% year-over-year and 24.1% quarter-over-quarter, based on estimations from TrendFocus. The company believes that the whole industry produced 29 EB of NAND flash (up 17% sequentially) and SSDs consumed 42.5% of that output. The major increase of NAND flash bit supply was driven by the ramp up of 3D NAND and TLC NAND memory by leading manufacturers. This is due to the growing demand for non-volatile storage from many applications and industries. While this fast growth of NAND supply looks impressive, several industry insiders are indicating that demand is outpacing supply, which would drive up prices. However larger chips help mitigate this issue, keeping cost/GB down.

Meanwhile, the average capacity of an SSD, combining consumer and enterprise, increased such that:

– 325 GB to 368 GB from Q1 2016 (a 13.2% QoQ growth) and,
– 268 GB to 368 GB from Q2 2015 (a 37.3% YoY growth)

The recent declines of NAND flash memory pricing made SSDs with 240/256 GB and higher capacities considerably more popular than they were a year ago in the PC segment, driving average client SSD capacity to 278 GB. Moreover, companies like Samsung and Toshiba introduced enterprise-class SSDs that can store 8 TB or even 15 TB of data, which helped average capacity of a datacenter-class SSD to increase to just over 1 TB for the first time in Q2 2016.

Average Capacities of SSDs by Top Manufacturers in Q2 2016
Data by TrendFocus
  Q2 2016
(av GB per unit)
Q1 2016
(av GB per unit)
Q2 2015
(av GB per unit)
Intel 445.4 288.0 331.6
Kingston 183.0 185.3 141.2
Lite-On 220.2 229.2 255.3
Micron 384.0 398.6 396.8
Samsung 420.4 360.2 283.3
SanDisk/Western Digital 452.0 227.4 243.2
SK Hynix 304.3 231.5 231.9
Toshiba 391.1 282.4 252.7
Others 264.8 281.2 164.6
Overall 368.2 GB/unit 324.9 GB/unit 268.2 GB/unit

Strong demand for high-capacity datacenter-class SSDs in the recent quarters, as well as shift for high-end models, has helped a number of companies increase the average SSD capacity per unit of their sales significantly in the second quarter both sequentially and year-over-year (the combination of HGST and SanDisk shipments under Western Digital brand somewhat distorts the picture, but it still is in line with general trends). Meanwhile, short supply of NAND and focus on unit sales triggered declines of average SSD capacities for companies like Kingston, Lite-On and some others.

Samsung Retains Leadership Amid Slight Drop of Unit Sales

Samsung controlled about 36.3% of the global NAND flash production in Q2 2016 based on revenue, according to DRAMeXchange. Moreover, its NAND bit shipments were up 15% sequentially, the same company reports. Nonetheless, when it comes to SSDs, the quarter was a mixed bag for the company.

Sales of Samsung SSDs in Q2 totaled 13.75 million units, up from 10.45 million in the same period a year before (an increase of 31.5%), but slightly down from 14.16 million units in Q1 (a decrease of 2.9%). Meanwhile, the total capacity of Samsung’s SSDs in the second quarter increased to 5.78 EB, up from 2.96 EB in Q2 2015 (up 51.2%, slower than the industry) and 5.1 EB in Q1 2016 (+12%, slower than the industry).

Due to a slight drop in unit sales, Samsung’s market share decreased to 40.2%. While the company is still well ahead of everyone else, its SSD unit shipments and market share have been decreasing for two straight quarters now. The reasons for that are more or less clear: the company is gradually increasing average capacities of its SSDs, boosting their average selling prices (average capacity of a Samsung SSD in Q2 was 420 GB), but the amount of NAND flash it can use for SSDs seems to be somewhat limited (we will discuss this issue below). As a result, Samsung focuses on more lucrative high-capacity drives, sacrificing market share and unit shipments for higher per-unit selling prices.

Western Digital’s SanDisk retained #2 position in the SSD market for Q2: it shipped 4.58 million drives (up 106% YoY and 6.2% QoQ) and increased its market share to 13.6% in Q2 2016. What is even more important is that the company doubled the amount of NAND flash memory it used for its SSDs from the previous quarter (2.07 EB vs 0.98 EB) and nearly quadrupled it from the same period a year ago (0.54 EB). The average capacity of a SanDisk SSD in the second quarter was 452 GB, according to TrendFocus, the highest in the industry. Despite the fact that SanDisk lost a part of its OEM SSD business lately, its performance on the SSD market in the recent quarters was rather impressive.

Important notice: When analyzing historical data for SanDisk, keep in mind that starting from the second quarter of 2016 sales of SanDisk and HGST are combined under the Western Digital name. HGST does not sell a lot of drives (in 1H 2015 it controlled roughly 1.0%-2.6% of the global SSD market, so its shipments were 200-600 thousand units per quarter at best), but it sells a lot of high-end high-capacity SAS SSDs. Therefore, the addition of HGST’s product mix to SanDisk’s has a strong impact on average SSD capacities of Western Digital.

Lite-On, which sells SSDs under Lite-On and Plextor trademarks, maintained its third place in the rankings of SSD makers with 9.7% market share, based on data from TrendFocus. The company sold 3.27 million drives (up 131% YoY, but down 14.9% QoQ) with a total capacity of 0.72 EB (up 100% YoY, but down 19% QoQ). Since Lite-On only serves the client PC market, the average capacity of its SSDs was 220 GB, down both sequentially and year-over-year. This happened because in the recent quarters Lite-On introduced a number of inexpensive drives (particularly, under its Plextor brand), which attracted consumers with budget constraints that typically focus on smaller drives anyway. One of the reasons why Lite-On released such Plextor drives was timing (the M8Pe-series high-end SSDs are hitting the market only now), but another was the short supply of NAND in general. As a result, the company managed to increase its unit sales, but at the cost of average capacities and ASPs.

Kingston managed to boost its SSD shipments slightly to 3.17 million units (up 24.3% YoY and 1.2% QoQ) in the second quarter and increased its market share to 9.4%. Its total data (exabyte) shipments remained flat sequentially but are +61% compared to the same period a year ago. Since Kingston serves the entry-level segment of the client PC market, the average capacity of its SSDs is among the lowest in the industry at ~183 GB.

Intel’s positions as a supplier of SSDs has not been particularly strong in recent quarters, but in Q2 2016 the company managed to increase sales of its SSDs to 2.29 million units (up 18.6% YoY and 83% QoQ) and overtook Micron and Toshiba. The total capacity of Intel’s SSDs shipped in the second quarter was around 1.02 EB, a 59% growth over the same period a year ago and 183% more than in the previous quarter. The average capacity of an Intel SSD also increased to 445 GB, which signals that the company was particularly successful with its high-capacity enterprise-class drives introduced in April.

Toshiba also managed to amplify shipments of its SSDs in Q2 2016. The company sold 2.02 million drives (up 122% YoY and 54.2% QoQ) and its Exabyte shipments totaled 0.79 EB (up 243.4% YoY and 113.5% QoQ). Toshiba’s average SSD capacity also increased significantly compared to previous quarters. Keep in mind that Toshiba supplies NAND memory to Phison (who sells it with its controllers) as well as to companies like Lite-On. Therefore, despite the relatively small market share (6%), Toshiba is not an underdog when it comes to SSDs. 

Micron and SK Hynix, who both the other NAND flash producing fabs, commanded 3.7% and 3.4% of the SSD market in Q2 2016 with shipments of 1.25 and 1.15 million units respectively. Micron has a strategy to become a vertically integrated maker of NAND-based devices and it expects sales of own-brand SSDs to get higher over time.

Client SSDs: Modules Are Gaining Momentum

Of the 33.7 million SSDs that various manufacturers shipped in Q1 2016, roughly 29.6 million of the solid-state drives sold were aimed at client PCs, compared to ~4 million were designed for servers. Sales of SSDs in the PC space increased 44% year-over-year, outpacing general market trends. The total available market of enterprise-grade SSDs hit 4.068 million units and grew healthy 37% YoY.

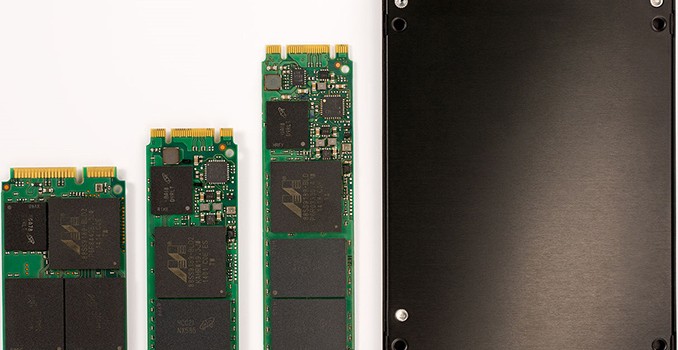
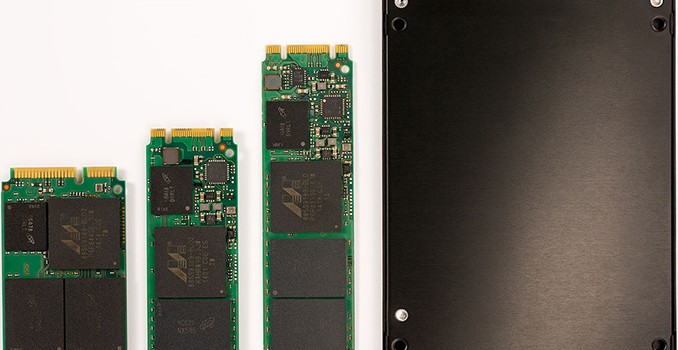
When it comes to SSDs for client computers, it is noteworthy that modules are gaining traction. In Q2, approximately 13 million of SSDs in M.2 or mSATA form factors were shipped, TrendFocus estimates. Growing popularity of SSD modules is conditioned by increasing market share of ultra-thin laptops (which modern 2.5-inch HDDs are reducing in importance) and adoption of PCIe-based drives by higher-end models. Shipments of solid-state drives in module form-factors are still behind sales of SSDs in traditional drive form-factors (i.e., M.2/ vs. 2.5”/7 mm), such that ~13 million M.2/mSATA units compared to 16.637 million units. Nonetheless, as PC form factors continue to shrink and performance of mainstream SSDs is getting higher, it is expected that modules with a PCIe interface will become more widespread in the client PCs. Some people even say that next year PCIe/NVMe SSDs in M.2 form-factor will go beyond module sales for 2.5” drives with a SATA interface.

Enterprise SSDs: SATA Is Still King of the Hill

Various data centers across the globe continued to replace their 10K/15K HDDs for mission-critical applications with SAS or even PCIe SSDs in the second quarter of the year. To hit performance targets (both in terms of IOPS and bandwidth), operators of data centers do not need a lot of such drives, which is why cumulative shipments of SAS and PCIe SSDs only hit ~870 thousand of units (668K SAS, 200K PCIe) in the aforementioned period. By contrast, with 3.2 million units shipped, SSDs with SATA interface remained the choice for the majority of enterprises.

TrendFocus believes that they key suppliers of enterprise-grade SSDs are Samsung, Intel and Western Digital (HGST). All three companies increased average capacities of their SSDs quite tangibly during the quarter, which may be an indicator that sales of their server drives were on rather high levels.

Demand for SSDs Poised to Rise, But Supply of NAND Remains Major Concern

Solid-state drives are becoming more widespread these days and in many cases they capture market share from traditional hard drives. The current demand for SSDs is healthy and shipments are growing, but there is a great concern about supply of NAND flash memory for SSDs. In fact, there are several factors which limit the amount of NAND flash memory available for solid-state drives:

  • The evolution of planar NAND has stalled at 14 nm or 16 nm nodes and we are hardly going to see any newly designed 2D NAND ICs suitable for SSDs. Manufacturers are not going to build new fabs to produce 2D NAND. Without geometry scaling and new production facilities, supply of 2D NAND will not grow. In fact, companies like Samsung are already mulling over cutting-down 2D capacities, thus reducing supply. There are talks about planar QLC NAND memory, however the feasibility of this technology is currently limited, with manufacturers discussing ‘write once, ready many’ applications only at this time.
  • 3D NAND yields and manufacturing volumes are gradually improving. In the meantime, demand for non-volatile memory is skyrocketing.
  • NAND flash makers have long-term supply agreements with large smartphone vendors (Apple, Samsung, etc.), who recently increased storage capacities of their flagship devices. Hence, manufacturers have to meet demand from such partners first.
  • China-based makers of smartphones now install 64 or 128 GB of NAND flash into their handsets and someone has to supply them the memory. Companies like Huawei, Oppo, Nubia and others sell hundreds of millions of smartphones every quarter and the amount of NAND they consume is gargantuan.

Some readers will notice that both production and consumption-related factors have already impacted Samsung. The company was the first to stop expanding its planar NAND manufacturing facilities and the first to start high-volume shipments of 3D NAND. At present, the company’s SSD sales are growing slower than the market due to tight supply of NAND. Other makers are barely expanding 2D production and yet have to transit to 3D NAND. As a result, we would not expect them to improve their output of flash memory significantly in the coming quarters.

The exponential growth of the demand for NAND flash memory amid a linear growth of its supply will ultimately have an impact on NAND and SSD pricing (the pace of depreciation of prices, to be precise). As a result, per-GB prices of SSDs may remain at the current levels for quite some time. In the coming months we are going to find out how stable pricing environment affects demand for SSDs.

*Please note that the numbers mentioned in this news story were determined from a combination of press releases and previous announcements from TrendFocus, or estimates based on previously released numbers and relationships by the company. If you need precise numbers for business decisions, you should acquire the full report from TrendFocus.

Recent Storage Reviews

The Toshiba OCZ VX500 Review: 256GB, 512GB and 1024GB
The Samsung 850 EVO Review: 4TB
Evaluating the Toshiba OCZ RD400 M.2 Drive on a Skylake NUC
The Intel 540s Review: 480GB
The Crucial MX300 Review: 750GB


Market Trends Q2 2016: SSD Shipments Up 41.2% YoY, PC Sales Up on Q1

Market Trends Q2 2016: SSD Shipments Up 41.2% YoY, PC Sales Up on Q1

Sales of SSDs in the first quarter of 2016 were up 41.2% year-over-year, based on findings from TrendFocus*, a storage market tracking company. Shipments of all types of SSDs, including drives for client and server systems, were up sequentially and year-over-year, which again proves that NAND-based storage devices are taking the place of traditional hard drives both inside client PCs and enterprise machines.

SSD Sales now above 33.7 Million Units

Shipments of SSDs in the second quarter hit 33.705 million units, which is nearly 10 million units higher than in the same period a year ago and up 9.5% from the previous quarter, according to TrendFocus. According to IDC and Gartner, sales of PCs were also relatively strong in Q2 compared to Q1: the industry sold 62.4-64.3m units, which is flat or slightly up (depending on who you take numbers from). Meanwhile, the SSD market for client PCs and servers has been growing rapidly for many quarters, therefore, and all-time high shipment units in Q2 came as no surprise.

SSD Market at Glance in Q2 2016
Data by TrendFocus
All numbers are millions of units, Exabytes or Gigabytes
  Form-Factor
(Units)
Interface
(Units)
Total Average
Capacity
Drives
2.5″/3.5″
Modules
mSATA/M.2
SATA SAS PCIe Units Exabytes
Client 16.637 13.0 ? ? ? 29.637 8.24 278 GB
Enterprise 3.868 0.2 3.2 0.668 0.2 4.068 4.17 1025 GB
 
Total 20.505 13.2 3.2 0.668 0.2 33.705 12.41 368 GB

There are multiple industrial trends that help to accelerate adoption of SSDs by both client PCs as well as servers:

Firstly, price. Entry-level SSDs are getting cheaper thanks to rapid per-GB price declines of TLC and 3D TLC NAND flash memory. This is combined through competition among vendors as well as the adoption of multiple module form-factors. In the second quarter, average contract prices of 128 and 256 GB SSDs dropped to $37.20 and $60.80 per unit, respectively, according to DRAMeXchange. For example, 120/128 GB SSDs for $35$38 are easy to find at Amazon. Moreover, there are plenty of drives with 240 GB or 256 GB capacities that cost less than $60 at Amazon.

Secondly, rapid performance improvements brought by NVMe protocol and new controllers supporting PCIe 3.0 bus stimulate strong demand for newer SSDs by enthusiasts and boutique PC makers.

Thirdly, new technologies (3D NAND, stacking, etc.) enable companies like Samsung and Toshiba to build SSDs that challenge HDDs not only in terms of performance but also in terms of capacities, thus stimulating demand from datacenters.

Average SSD Capacity Hits 368 GB

The total capacity of all SSDs sold in the second quarter achieved 12.47 Exabytes, up 93% year-over-year and 24.1% quarter-over-quarter, based on estimations from TrendFocus. The company believes that the whole industry produced 29 EB of NAND flash (up 17% sequentially) and SSDs consumed 42.5% of that output. The major increase of NAND flash bit supply was driven by the ramp up of 3D NAND and TLC NAND memory by leading manufacturers. This is due to the growing demand for non-volatile storage from many applications and industries. While this fast growth of NAND supply looks impressive, several industry insiders are indicating that demand is outpacing supply, which would drive up prices. However larger chips help mitigate this issue, keeping cost/GB down.

Meanwhile, the average capacity of an SSD, combining consumer and enterprise, increased such that:

– 325 GB to 368 GB from Q1 2016 (a 13.2% QoQ growth) and,
– 268 GB to 368 GB from Q2 2015 (a 37.3% YoY growth)

The recent declines of NAND flash memory pricing made SSDs with 240/256 GB and higher capacities considerably more popular than they were a year ago in the PC segment, driving average client SSD capacity to 278 GB. Moreover, companies like Samsung and Toshiba introduced enterprise-class SSDs that can store 8 TB or even 15 TB of data, which helped average capacity of a datacenter-class SSD to increase to just over 1 TB for the first time in Q2 2016.

Average Capacities of SSDs by Top Manufacturers in Q2 2016
Data by TrendFocus
  Q2 2016
(av GB per unit)
Q1 2016
(av GB per unit)
Q2 2015
(av GB per unit)
Intel 445.4 288.0 331.6
Kingston 183.0 185.3 141.2
Lite-On 220.2 229.2 255.3
Micron 384.0 398.6 396.8
Samsung 420.4 360.2 283.3
SanDisk/Western Digital 452.0 227.4 243.2
SK Hynix 304.3 231.5 231.9
Toshiba 391.1 282.4 252.7
Others 264.8 281.2 164.6
Overall 368.2 GB/unit 324.9 GB/unit 268.2 GB/unit

Strong demand for high-capacity datacenter-class SSDs in the recent quarters, as well as shift for high-end models, has helped a number of companies increase the average SSD capacity per unit of their sales significantly in the second quarter both sequentially and year-over-year (the combination of HGST and SanDisk shipments under Western Digital brand somewhat distorts the picture, but it still is in line with general trends). Meanwhile, short supply of NAND and focus on unit sales triggered declines of average SSD capacities for companies like Kingston, Lite-On and some others.

Samsung Retains Leadership Amid Slight Drop of Unit Sales

Samsung controlled about 36.3% of the global NAND flash production in Q2 2016 based on revenue, according to DRAMeXchange. Moreover, its NAND bit shipments were up 15% sequentially, the same company reports. Nonetheless, when it comes to SSDs, the quarter was a mixed bag for the company.

Sales of Samsung SSDs in Q2 totaled 13.75 million units, up from 10.45 million in the same period a year before (an increase of 31.5%), but slightly down from 14.16 million units in Q1 (a decrease of 2.9%). Meanwhile, the total capacity of Samsung’s SSDs in the second quarter increased to 5.78 EB, up from 2.96 EB in Q2 2015 (up 51.2%, slower than the industry) and 5.1 EB in Q1 2016 (+12%, slower than the industry).

Due to a slight drop in unit sales, Samsung’s market share decreased to 40.2%. While the company is still well ahead of everyone else, its SSD unit shipments and market share have been decreasing for two straight quarters now. The reasons for that are more or less clear: the company is gradually increasing average capacities of its SSDs, boosting their average selling prices (average capacity of a Samsung SSD in Q2 was 420 GB), but the amount of NAND flash it can use for SSDs seems to be somewhat limited (we will discuss this issue below). As a result, Samsung focuses on more lucrative high-capacity drives, sacrificing market share and unit shipments for higher per-unit selling prices.

Western Digital’s SanDisk retained #2 position in the SSD market for Q2: it shipped 4.58 million drives (up 106% YoY and 6.2% QoQ) and increased its market share to 13.6% in Q2 2016. What is even more important is that the company doubled the amount of NAND flash memory it used for its SSDs from the previous quarter (2.07 EB vs 0.98 EB) and nearly quadrupled it from the same period a year ago (0.54 EB). The average capacity of a SanDisk SSD in the second quarter was 452 GB, according to TrendFocus, the highest in the industry. Despite the fact that SanDisk lost a part of its OEM SSD business lately, its performance on the SSD market in the recent quarters was rather impressive.

Important notice: When analyzing historical data for SanDisk, keep in mind that starting from the second quarter of 2016 sales of SanDisk and HGST are combined under the Western Digital name. HGST does not sell a lot of drives (in 1H 2015 it controlled roughly 1.0%-2.6% of the global SSD market, so its shipments were 200-600 thousand units per quarter at best), but it sells a lot of high-end high-capacity SAS SSDs. Therefore, the addition of HGST’s product mix to SanDisk’s has a strong impact on average SSD capacities of Western Digital.

Lite-On, which sells SSDs under Lite-On and Plextor trademarks, maintained its third place in the rankings of SSD makers with 9.7% market share, based on data from TrendFocus. The company sold 3.27 million drives (up 131% YoY, but down 14.9% QoQ) with a total capacity of 0.72 EB (up 100% YoY, but down 19% QoQ). Since Lite-On only serves the client PC market, the average capacity of its SSDs was 220 GB, down both sequentially and year-over-year. This happened because in the recent quarters Lite-On introduced a number of inexpensive drives (particularly, under its Plextor brand), which attracted consumers with budget constraints that typically focus on smaller drives anyway. One of the reasons why Lite-On released such Plextor drives was timing (the M8Pe-series high-end SSDs are hitting the market only now), but another was the short supply of NAND in general. As a result, the company managed to increase its unit sales, but at the cost of average capacities and ASPs.

Kingston managed to boost its SSD shipments slightly to 3.17 million units (up 24.3% YoY and 1.2% QoQ) in the second quarter and increased its market share to 9.4%. Its total data (exabyte) shipments remained flat sequentially but are +61% compared to the same period a year ago. Since Kingston serves the entry-level segment of the client PC market, the average capacity of its SSDs is among the lowest in the industry at ~183 GB.

Intel’s positions as a supplier of SSDs has not been particularly strong in recent quarters, but in Q2 2016 the company managed to increase sales of its SSDs to 2.29 million units (up 18.6% YoY and 83% QoQ) and overtook Micron and Toshiba. The total capacity of Intel’s SSDs shipped in the second quarter was around 1.02 EB, a 59% growth over the same period a year ago and 183% more than in the previous quarter. The average capacity of an Intel SSD also increased to 445 GB, which signals that the company was particularly successful with its high-capacity enterprise-class drives introduced in April.

Toshiba also managed to amplify shipments of its SSDs in Q2 2016. The company sold 2.02 million drives (up 122% YoY and 54.2% QoQ) and its Exabyte shipments totaled 0.79 EB (up 243.4% YoY and 113.5% QoQ). Toshiba’s average SSD capacity also increased significantly compared to previous quarters. Keep in mind that Toshiba supplies NAND memory to Phison (who sells it with its controllers) as well as to companies like Lite-On. Therefore, despite the relatively small market share (6%), Toshiba is not an underdog when it comes to SSDs. 

Micron and SK Hynix, who both the other NAND flash producing fabs, commanded 3.7% and 3.4% of the SSD market in Q2 2016 with shipments of 1.25 and 1.15 million units respectively. Micron has a strategy to become a vertically integrated maker of NAND-based devices and it expects sales of own-brand SSDs to get higher over time.

Client SSDs: Modules Are Gaining Momentum

Of the 33.7 million SSDs that various manufacturers shipped in Q1 2016, roughly 29.6 million of the solid-state drives sold were aimed at client PCs, compared to ~4 million were designed for servers. Sales of SSDs in the PC space increased 44% year-over-year, outpacing general market trends. The total available market of enterprise-grade SSDs hit 4.068 million units and grew healthy 37% YoY.

When it comes to SSDs for client computers, it is noteworthy that modules are gaining traction. In Q2, approximately 13 million of SSDs in M.2 or mSATA form factors were shipped, TrendFocus estimates. Growing popularity of SSD modules is conditioned by increasing market share of ultra-thin laptops (which modern 2.5-inch HDDs are reducing in importance) and adoption of PCIe-based drives by higher-end models. Shipments of solid-state drives in module form-factors are still behind sales of SSDs in traditional drive form-factors (i.e., M.2/ vs. 2.5”/7 mm), such that ~13 million M.2/mSATA units compared to 16.637 million units. Nonetheless, as PC form factors continue to shrink and performance of mainstream SSDs is getting higher, it is expected that modules with a PCIe interface will become more widespread in the client PCs. Some people even say that next year PCIe/NVMe SSDs in M.2 form-factor will go beyond module sales for 2.5” drives with a SATA interface.

Enterprise SSDs: SATA Is Still King of the Hill

Various data centers across the globe continued to replace their 10K/15K HDDs for mission-critical applications with SAS or even PCIe SSDs in the second quarter of the year. To hit performance targets (both in terms of IOPS and bandwidth), operators of data centers do not need a lot of such drives, which is why cumulative shipments of SAS and PCIe SSDs only hit ~870 thousand of units (668K SAS, 200K PCIe) in the aforementioned period. By contrast, with 3.2 million units shipped, SSDs with SATA interface remained the choice for the majority of enterprises.

TrendFocus believes that they key suppliers of enterprise-grade SSDs are Samsung, Intel and Western Digital (HGST). All three companies increased average capacities of their SSDs quite tangibly during the quarter, which may be an indicator that sales of their server drives were on rather high levels.

Demand for SSDs Poised to Rise, But Supply of NAND Remains Major Concern

Solid-state drives are becoming more widespread these days and in many cases they capture market share from traditional hard drives. The current demand for SSDs is healthy and shipments are growing, but there is a great concern about supply of NAND flash memory for SSDs. In fact, there are several factors which limit the amount of NAND flash memory available for solid-state drives:

  • The evolution of planar NAND has stalled at 14 nm or 16 nm nodes and we are hardly going to see any newly designed 2D NAND ICs suitable for SSDs. Manufacturers are not going to build new fabs to produce 2D NAND. Without geometry scaling and new production facilities, supply of 2D NAND will not grow. In fact, companies like Samsung are already mulling over cutting-down 2D capacities, thus reducing supply. There are talks about planar QLC NAND memory, however the feasibility of this technology is currently limited, with manufacturers discussing ‘write once, ready many’ applications only at this time.
  • 3D NAND yields and manufacturing volumes are gradually improving. In the meantime, demand for non-volatile memory is skyrocketing.
  • NAND flash makers have long-term supply agreements with large smartphone vendors (Apple, Samsung, etc.), who recently increased storage capacities of their flagship devices. Hence, manufacturers have to meet demand from such partners first.
  • China-based makers of smartphones now install 64 or 128 GB of NAND flash into their handsets and someone has to supply them the memory. Companies like Huawei, Oppo, Nubia and others sell hundreds of millions of smartphones every quarter and the amount of NAND they consume is gargantuan.

Some readers will notice that both production and consumption-related factors have already impacted Samsung. The company was the first to stop expanding its planar NAND manufacturing facilities and the first to start high-volume shipments of 3D NAND. At present, the company’s SSD sales are growing slower than the market due to tight supply of NAND. Other makers are barely expanding 2D production and yet have to transit to 3D NAND. As a result, we would not expect them to improve their output of flash memory significantly in the coming quarters.

The exponential growth of the demand for NAND flash memory amid a linear growth of its supply will ultimately have an impact on NAND and SSD pricing (the pace of depreciation of prices, to be precise). As a result, per-GB prices of SSDs may remain at the current levels for quite some time. In the coming months we are going to find out how stable pricing environment affects demand for SSDs.

*Please note that the numbers mentioned in this news story were determined from a combination of press releases and previous announcements from TrendFocus, or estimates based on previously released numbers and relationships by the company. If you need precise numbers for business decisions, you should acquire the full report from TrendFocus.

Recent Storage Reviews

The Toshiba OCZ VX500 Review: 256GB, 512GB and 1024GB
The Samsung 850 EVO Review: 4TB
Evaluating the Toshiba OCZ RD400 M.2 Drive on a Skylake NUC
The Intel 540s Review: 480GB
The Crucial MX300 Review: 750GB