Smartphones


Verizon Galaxy S5 Receiving Lollipop Update

Verizon Galaxy S5 Receiving Lollipop Update

After arriving in certain European countries not long ago, the Android 5.0 Lollipop update for the Galaxy S5 has finally made its way to the United States. Oddly enough, it’s the Verizon variant of the Galaxy S5 that is receiving the update before any of the other carriers. The changes listed on Verizon’s page for the update are below, and they include both changes made in Lollipop and Samsung specific changes that relate to Touchwiz.

  • Material Design
    • Android Lollipop brings the all-new material design offering fluid animations, vivid colored themes, and 3-D views for a more pleasurable experience
  • Basic Interaction
    • Bolder color and more fluid animations
    • The on/off toggle button style updated based on material design 
  • Lock Screen
    • The shortcuts for both Phone and Camera are provided for convenience
    • Material design-inspired notifications
    • Ability to set priority and privacy for notifications on lock screen
    • Provide music control as a card to utilize the real estate of the lock screen UI 
  • Touchwiz
    •  Brighter look and feel, bold colors, fluid animation inspired by material design.  
  • Floating Action Button
    • Floating action buttons provide easy access to the app’s most important features, such as adding a new contact or favorite, or composing a text message.
  • Interruptions
    • Interruptions give you more advanced options to control your sound settings
    • Priority notifications such as events and reminders, phone calls, and messages can be set up to sound or vibrate while all other notifications are muted.
    • Set downtime for specific days and times to control notification sounds automatically
  • Recents
    •  Easy access to your Chrome tabs right from the Recent apps page • Multi-window icons for ease-of-use during multi-tasking

The Verizon document also has pictures that accompany the changelog so users can see what visual changes are heading their way, and any interested users can view that PDF in the source below. The rollout is staged, and users shouldn’t be concerned if their device currently doesn’t show any updates available.

It’s good to see more devices receiving the update to Lollipop. Enough devices have been updated for it to show up on Google’s platform version dashboard. In January less than 0.1% of Android devices were running Lollipop which meant that it was not displayed in the chart or on the graph. Still, at 1.6% of all Android devices, one can only hope that the adoption rate increases so more users can experience the latest version of Google’s operating system.

Source: Verizon via Android Central

Google Announces Support For 40 Third-Party App Cards In Google Now

Google Announces Support For 40 Third-Party App Cards In Google Now

Google Now has always been good at giving you relevant information about things like transit, emails, stocks, sport scores, etc. But everything it displays is linked to a Google product in some way, which means that even with Google’s vast accessible information, the scope of what information Google Now can provide is limited. 

Today Google has announced an update for the Google application on Android. The update allows Google Now to display cards with relevant information from 40 different third party Android applications. The list of third party apps includes some big names like Lyft, Pandora, and Airbnb, and it’s not hard to imagine how the ability to display relevant and actionable info in Google Now could make the experience of using these apps even better. The full list of partnered applications can be found here on the Google Now webpage, and you can see some example cards in the image above.

According to Google, the update to the core Google app on Android is rolling out now, and updates for cards from the developers Google has partnered with will be rolling out over the next few weeks. Google also intends to expand the library of supported third-party applications over time.

Google Announces Support For 40 Third-Party App Cards In Google Now

Google Announces Support For 40 Third-Party App Cards In Google Now

Google Now has always been good at giving you relevant information about things like transit, emails, stocks, sport scores, etc. But everything it displays is linked to a Google product in some way, which means that even with Google’s vast accessible information, the scope of what information Google Now can provide is limited. 

Today Google has announced an update for the Google application on Android. The update allows Google Now to display cards with relevant information from 40 different third party Android applications. The list of third party apps includes some big names like Lyft, Pandora, and Airbnb, and it’s not hard to imagine how the ability to display relevant and actionable info in Google Now could make the experience of using these apps even better. The full list of partnered applications can be found here on the Google Now webpage, and you can see some example cards in the image above.

According to Google, the update to the core Google app on Android is rolling out now, and updates for cards from the developers Google has partnered with will be rolling out over the next few weeks. Google also intends to expand the library of supported third-party applications over time.

Apple Q1 FY 2015 Financial Results: Record iPhone Sales Drive Record Earnings

Apple Q1 FY 2015 Financial Results: Record iPhone Sales Drive Record Earnings

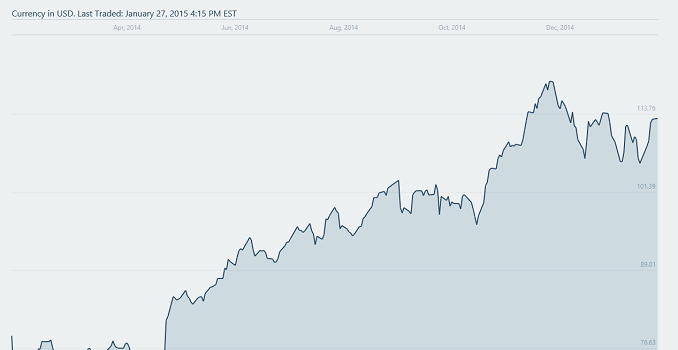
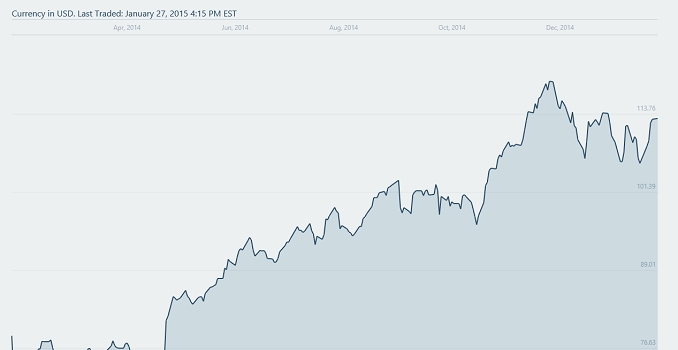
Apple announced its earnings today for their first quarter of fiscal year 2015, with the quarter ending on December 27th 2014. This was a huge quarter for them, with new iPads, iMac coming to market, and of course the iPhone which launched right at the tail end of their last quarter. New products plus the busy holiday season gave Apple its highest quarterly results ever, with a staggering $74.6 billion in revenue, and a net profit of $18 billion. That is a 29.5% growth in revenue year-over-year, and a 37.4% increase in net profit. Gross margin was up 2% to 39.9% as compared to Q1 2014, and earnings per share came in at $3.08, which was much higher than analysts’ expectations.

Apple Q1 2015 Financial Results (GAAP)
  Q1’2015 Q4’2014 Q1’2014
Revenue (in Billions USD) $74.599 $42.123 $57.594
Operating Income (in Billions USD) $24.246 $11.165 $17.463
Gross Margin (in Billions USD) $29.741 $16.009 $21.846
Net Income (in Billions USD) $18.024 $8.467 $13.072
Margins 39.9% 38.0% 37.9%
Earnings per Share (in USD) $3.08 $1.43 $2.08

The story of Apple is the iPhone, which was updated in September with two new models with larger displays. Clearly the market wanted this, even if our own Ryan Smith still swears by his smaller iPhone 5 display. Sales of the iPhone for Q1 totaled 74.5 million units, with over $51 billion in revenue. Compared to Q4 2014, when the iPhone 6 and 6+ had just launched, that is a 90% increase in sales sequentially. The holiday quarter is always strong, but even year-over-year the increase in units was up 46%, with revenue up 57%. Average Selling Price (ASP) for this quarter’s iPhones was $687.30, which is up significantly over last quarter’s ASP of $602.92 and last year’s $636.90. Clearly there was quite a bit of pent up demand for a larger iPhone.

Apple Q1 2015 Device Sales (thousands)
  Q1’2015 Q4’2014 Q1’2014 Seq Change Year/Year Change
iPhone 74,468 39,272 51,025 +90% +46%
iPad 21,419 12,316 26,035 +74% -18%
Mac 5,519 5,520 4,837 0% +14%

Next up from Apple is iPad sales, which struggled over the last year. Last quarter, the Mac overtook iPad for revenue. The new iPads did reverse that trend, with a 74% increase in units sold since the last quarter. 21.4 million iPads were sold in Q1, with revenue coming in at $8.985 billion, which works out to a ASP of $419.49. While this was a big jump from last quarter, it was still down 18% year-over-year, and revenue was down 22% from Q1 2014. Sales are still good, but iPad sales have not followed iPhone sales with large growth with each new model.

The Mac had another good quarter, with a 14% increase in units sold year-over-year. Apple sold 5.5 million Macs in Q1, which was about the same as they sold in Q4 2014, but the ASP was up slightly which resulted in a 5% gain in revenue since last quarter. Year-over-year revenue was up 9%. These are great numbers, especially when the PC market as a whole has been pretty much flat for the year, and Apple has not really updated the Mac in the last couple of quarters other than the new 5K iMac.

Apple’s iTunes, App Store, Mac App Store, iBooks, AppleCare, Apple Pay, and licensing fall into their Services segment, and this business line had modest growth of 4% quarter-over-quarter and 9% year-over-year, with it now pulling in almost $4.8 billion per quarter.

Other Products is the final category, and it includes iPod, Apple TV, Beats, and accessories. The lowly iPod, which vaulted Apple up through the 2000’s, is no longer broken down by units sold. The Other Products category had a 42% sequential increase in revenue, and a 5% loss in revenue as compared to Q1 2014, with $2.689 billion this quarter.

Apple Q1 2015 Revenue by Product (billions)
  Q1’2015 Q4’2014 Q1’2014 Revenue for current quarter
iPhone $51.182 $23.678 $32.498 68.6%
iPad $8.985 $5.316 $11.468 12.1%
Mac $6.944 $6.625 $6.395 9.3%
iTunes/Software/Services $4.799 $4.608 $4.397 6.4%
Other Products $2.689 $1.896 $2.836 3.6%

Right now, the iPhone is Apple. It accounts for 68.6% of the company’s revenue for this quarter, and iPhone revenue alone is about the same as Microsoft ($26.47B), Google ($16.52B), and Intel ($14.72B) combined. This has allowed Apple to return $57 billion to shareholders over the last twelve months, and they have declared a dividend of $0.47 per share, payable on February 12th. Looking forward, Apple is expecting revenue between $52 and 55 billion, and gross margin between 38.5% and 39.5% for the next quarter.

Source: Apple Investor Relations

Apple Q1 FY 2015 Financial Results: Record iPhone Sales Drive Record Earnings

Apple Q1 FY 2015 Financial Results: Record iPhone Sales Drive Record Earnings

Apple announced its earnings today for their first quarter of fiscal year 2015, with the quarter ending on December 27th 2014. This was a huge quarter for them, with new iPads, iMac coming to market, and of course the iPhone which launched right at the tail end of their last quarter. New products plus the busy holiday season gave Apple its highest quarterly results ever, with a staggering $74.6 billion in revenue, and a net profit of $18 billion. That is a 29.5% growth in revenue year-over-year, and a 37.4% increase in net profit. Gross margin was up 2% to 39.9% as compared to Q1 2014, and earnings per share came in at $3.08, which was much higher than analysts’ expectations.

Apple Q1 2015 Financial Results (GAAP)
  Q1’2015 Q4’2014 Q1’2014
Revenue (in Billions USD) $74.599 $42.123 $57.594
Operating Income (in Billions USD) $24.246 $11.165 $17.463
Gross Margin (in Billions USD) $29.741 $16.009 $21.846
Net Income (in Billions USD) $18.024 $8.467 $13.072
Margins 39.9% 38.0% 37.9%
Earnings per Share (in USD) $3.08 $1.43 $2.08

The story of Apple is the iPhone, which was updated in September with two new models with larger displays. Clearly the market wanted this, even if our own Ryan Smith still swears by his smaller iPhone 5 display. Sales of the iPhone for Q1 totaled 74.5 million units, with over $51 billion in revenue. Compared to Q4 2014, when the iPhone 6 and 6+ had just launched, that is a 90% increase in sales sequentially. The holiday quarter is always strong, but even year-over-year the increase in units was up 46%, with revenue up 57%. Average Selling Price (ASP) for this quarter’s iPhones was $687.30, which is up significantly over last quarter’s ASP of $602.92 and last year’s $636.90. Clearly there was quite a bit of pent up demand for a larger iPhone.

Apple Q1 2015 Device Sales (thousands)
  Q1’2015 Q4’2014 Q1’2014 Seq Change Year/Year Change
iPhone 74,468 39,272 51,025 +90% +46%
iPad 21,419 12,316 26,035 +74% -18%
Mac 5,519 5,520 4,837 0% +14%

Next up from Apple is iPad sales, which struggled over the last year. Last quarter, the Mac overtook iPad for revenue. The new iPads did reverse that trend, with a 74% increase in units sold since the last quarter. 21.4 million iPads were sold in Q1, with revenue coming in at $8.985 billion, which works out to a ASP of $419.49. While this was a big jump from last quarter, it was still down 18% year-over-year, and revenue was down 22% from Q1 2014. Sales are still good, but iPad sales have not followed iPhone sales with large growth with each new model.

The Mac had another good quarter, with a 14% increase in units sold year-over-year. Apple sold 5.5 million Macs in Q1, which was about the same as they sold in Q4 2014, but the ASP was up slightly which resulted in a 5% gain in revenue since last quarter. Year-over-year revenue was up 9%. These are great numbers, especially when the PC market as a whole has been pretty much flat for the year, and Apple has not really updated the Mac in the last couple of quarters other than the new 5K iMac.

Apple’s iTunes, App Store, Mac App Store, iBooks, AppleCare, Apple Pay, and licensing fall into their Services segment, and this business line had modest growth of 4% quarter-over-quarter and 9% year-over-year, with it now pulling in almost $4.8 billion per quarter.

Other Products is the final category, and it includes iPod, Apple TV, Beats, and accessories. The lowly iPod, which vaulted Apple up through the 2000’s, is no longer broken down by units sold. The Other Products category had a 42% sequential increase in revenue, and a 5% loss in revenue as compared to Q1 2014, with $2.689 billion this quarter.

Apple Q1 2015 Revenue by Product (billions)
  Q1’2015 Q4’2014 Q1’2014 Revenue for current quarter
iPhone $51.182 $23.678 $32.498 68.6%
iPad $8.985 $5.316 $11.468 12.1%
Mac $6.944 $6.625 $6.395 9.3%
iTunes/Software/Services $4.799 $4.608 $4.397 6.4%
Other Products $2.689 $1.896 $2.836 3.6%

Right now, the iPhone is Apple. It accounts for 68.6% of the company’s revenue for this quarter, and iPhone revenue alone is about the same as Microsoft ($26.47B), Google ($16.52B), and Intel ($14.72B) combined. This has allowed Apple to return $57 billion to shareholders over the last twelve months, and they have declared a dividend of $0.47 per share, payable on February 12th. Looking forward, Apple is expecting revenue between $52 and 55 billion, and gross margin between 38.5% and 39.5% for the next quarter.

Source: Apple Investor Relations